Glen Mazza's Weblog
 Sunday May 07, 2017
Tracing SOAP calls with Wireshark
The Wireshark network protocol analyzer nicely complements soapUI usage in testing and debugging web service calls. It's available on most major platforms including the main distributions of Linux (for Ubuntu for example, command-line sudo apt-get install wireshark is all that's needed.). Although Wireshark is a general purpose network sniffer not particularly specialized for trapping SOAP messages, it offers benefits over SOAP-specific tracing products in certain cases, including:
- A desire to see SOAP calls being made by the SOAP client without having the tool itself initiate the call.
- Capturing and inspecting an ongoing conversation of SOAP calls between the client, service, and helper services such as a security token service (STS).
- Obtaining HTML error messages returned by the application server that is hosting the web service (non-SOAP response messages are frequently not processable by SOAP clients).
More information on Wireshark can be obtained from its online documentation and after-installation man pages, also numerous YouTube video tutorials are available. I would take particular note on the easy usage of display filters to filter the results that you receive. These filters can be typed in either directly in the Filter edit field (e.g., "http" to focus on the SOAP calls) or by right-clicking individual attributes in the Packet Details pane and selecting "Apply as Filter" to see only packets with that attribute. Clear the Filter field to see all the returned packets again.
Two points of caution prior to working with Wireshark: The tool can obviously handle unencrypted traffic out of the box and transport-layer (SSL) encrypted messages can be unencrypted with additional configuration (see here and here for more information). However, I'm unaware of a way Wireshark can decrypt message-layer encryption (in which the SOAP envelope is unencrypted but sensitive parts within it are not). Also, if you're using Windows, you may have problems with tracing the client and service if they are on the same machine. On Windows, calls to localhost (127.0.0.1) cannot be captured because they do not trigger TCP/IP activity on that operating system so you will probably need to host the web service on a machine different from the SOAP client or try alternative solutions suggested on the Wireshark Wiki.
Wireshark provides many command-line options for startup although the defaults should be sufficient. Administrator (i.e., root with Linux, sudo wireshark) permissions are normally needed for capturing traffic as opposed to just viewing the traffic within Wireshark. However, for safety against various exploits, the Wireshark team advises against running Wireshark under a root account whenever possible, please see the CaptureSetup/CapturePrivileges section for your operating system to see how to capture and subsequently view traffic with the minimum roles possible.
For me using Ubuntu and tracking the SOAP requests and responses from my intro "DoubleIt" web service tutorial, I ran their dumpcap utility as advised (sudo dumpcap -i lo for localhost capture), made my SOAP calls, and then terminated dumpcap. The utility displays the filename it used to store the capture, however it will be owned by root, so chown the file to your local (non-root) account and start Wireshark without sudo. Within Wireshark choose menu option File | Open to read the capture file just created.
For the less secure method of running the capture within Wireshark, sudo wireshark, go to the Capture | Interfaces menu item, and choose the network device the SOAP messages will be sent and received over--ethernet or (lo)opback--as shown here. Clicking "start" on this screen for the correct device starts the network packet capture. Then, make the web service call, and once it's complete, stop the capture and analyze the results. You can also save the results to a file for later analysis.
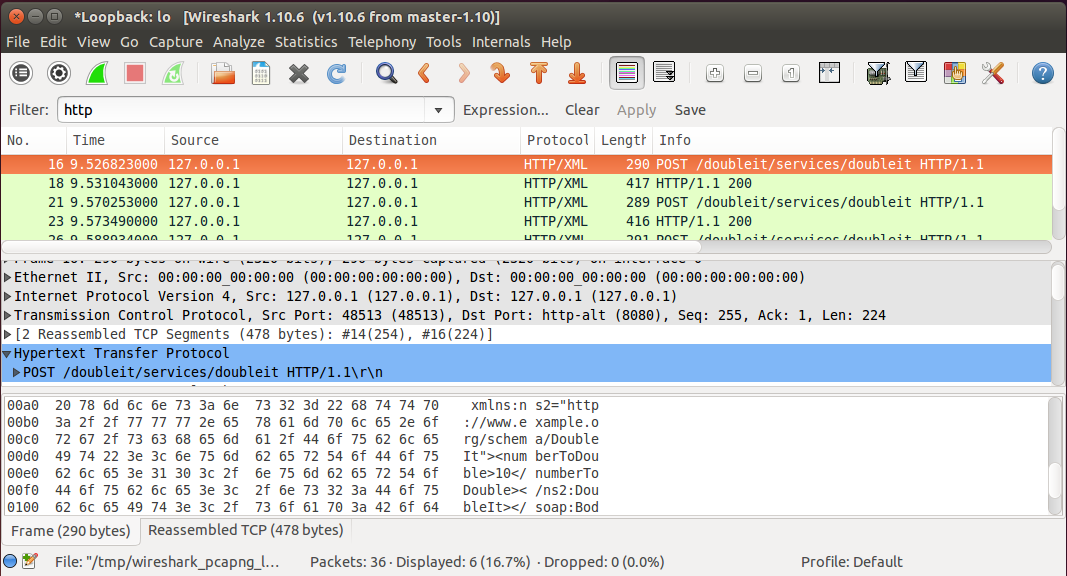
The below screenshot shows Wireshark results from a web service call (screen shrunk for the illustration below, more data can normally be viewed):
|
Three suggestions for tracing SOAP calls with Wireshark:
When viewing the capture results within Wireshark, usually best to first enter "http" as a display filter to immediately shink the packets listed to primarily just those related to the SOAP requests and responses.
Right-clicking a packet containing the SOAP message and selecting Copy->Bytes (Printable Text Only) will give you a byte string you can use to copy-and-paste the SOAP message. For large messages, however, you may need to do this for multiple packets and concatenate them.
Most conveniently, right-clicking a packet which is part of a SOAP request and response stream and selecting Follow TCP Stream will provide the SOAP XML of the request and response in a fairly readable format in a separate editor window. The output can be further improved by copy-and-pasting it into editors such as IntelliJ or Eclipse that support formatting/indentation of XML files. Note that this feature adds a display filter showing you which packets are part of that particular request and response, so if you have other SOAP calls as part of the conversation just clear the display filter to see all the packets again and then follow the TCP stream for other packets as desired. A sample SOAP request/response stream from the DoubleIt web service appears as follows:
POST /doubleit/services/doubleit HTTP/1.1
Content-type: text/xml;charset=utf-8
Soapaction: ""
Accept: text/xml, multipart/related
User-Agent: JAX-WS RI 2.2-hudson-752-
Host: localhost:8080
Connection: keep-alive
Content-Length: 247

POST /doubleit/services/doubleit HTTP/1.1
Content-Type: text/xml; charset=UTF-8
Accept: */*
SOAPAction: ""
User-Agent: Apache-CXF/3.1.10
Cache-Control: no-cache
Pragma: no-cache
Host: localhost:8080
Connection: keep-alive
Content-Length: 224
<soap:Envelope xmlns:soap="http://schemas.xmlsoap.org/soap/envelope/"><soap:Body><ns2:DoubleIt xmlns:ns2="http://www.example.org/schema/DoubleIt"><numberToDouble>10</numberToDouble></ns2:DoubleIt></soap:Body></soap:Envelope>HTTP/1.1 200
Content-Type: text/xml;charset=UTF-8
Content-Length: 238
Date: Wed, 03 May 2017 01:09:13 GMT
<soap:Envelope xmlns:soap="http://schemas.xmlsoap.org/soap/envelope/"><soap:Body><ns2:DoubleItResponse xmlns:ns2="http://www.example.org/schema/DoubleIt"><doubledNumber>20</doubledNumber></ns2:DoubleItResponse></soap:Body></soap:Envelope>
Posted by Glen Mazza in Web Services at 07:00AM May 07, 2017 | Comments[0]
Post a Comment:
Calendar
About Me

Blog Search
Links
Recent Posts
Recent Comments
- - Nitin Lokhande on Deploying TightBlog on Linode
- - Ralph Callaway on Activating Transport Layer Security (SSL) for CXF web services
- - Vlad BALAN on Using X.509 security with Apache CXF
- - Juan Moreno on Switching from SOAP 1.1 to SOAP 1.2 messages
- - Anant Jaynarayana on Deploying TightBlog on Linode
- - John Power on Deploying and Using a CXF Security Token Service (STS)
About Blog
Application Server: Tomcat
Database: MySQL
Hosted on: Linode
SSL Certificate: Let's Encrypt